Technical DataSimplifying complexity
Our flexible and systematized approach generates reliable user-friendly solutions.
A sample HealthCare scenario
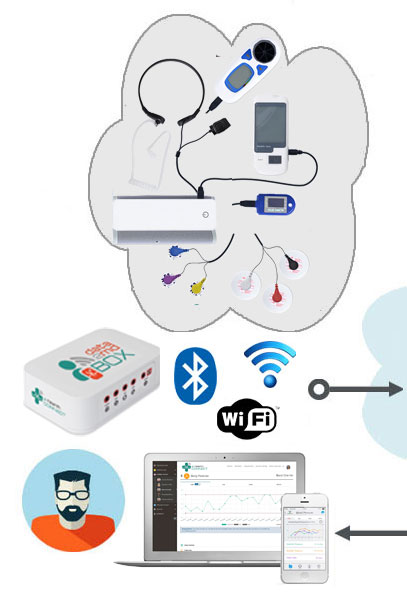
This scenario describes e-Health-Connect experimental IoT Platform sharing data from various sensor devices. The application is built to help physicians to make a diagnosis, to deliver notifications to patients about their health condition and to produce health statistics and predictive analysis.
The patient part of the app sends data from sensors (heartbeat, electrocardiogram - ECG - waveform, breathing rate, glucose levels...) to the e-Health-Connect IoT Platform via the Cloud.
The physician part of the application receives and displays the data for evaluation and statistical analysis.

Patient environnement
The patient environment consists of a group of various Sensors, of a Sensor Data Publisher Module and of Patient Applications stored on a PC and/or on iPhone and Android devices.
Sensors
The various sensors connected to the e-Health-Connect experimental IOT Platform are able to measure 20 different biometric parameters such as pulse, breath rate, oxygen in blood, electrocardiogram signals, blood pressure, muscle electromyography signals, glucose levels, galvanic skin response, lung capacity, snore waves, patient position, airflow and body scale parameters (weight, bone mass, body fat, muscle mass, body water, visceral fat, Basal Metabolic Rate and Body Mass Index).
Sensor Data Publisher Module - The "Data2md BOX"
Our "Data2md BOX" plays the role of Sensor Data Publisher Module. It receives the data from sensors, then send it to the Cloud in order to allow the visualization by physicians of all the information gathered.
Receiving Data
Depending if they are wireless or not, the sensors communicate with the "Data2md BOX" in two different modes:
Sending Data
The Sensor "Data2md BOX" uses two different modes to send the information gathered from the sensors:
Patient application
Biometric information gathered may be displayed on a Patient application stored on mobile devices (iOS or Android smartphones or tablets) via BLE (Bluetooth Low Energy) as well as on a PC connected via Wifi to the Cloud.

IoT Platform
The e-Health-Connect IoT Platform allows to share data with the cloud, and perform real-time analysis.
Web Server Application
The IOT Platform include a Web Server Application allowing real-time data viewing and data analysis.
Thanks to its powerful built-in features and its user-friendly interface, it is easy to configure the Web Server Application for creating specific profiles depending on the physicians speciality.
Privacy of the biometric data
Privacy is one of the key points in this kind of applications.
For this reason the platform includes several security levels:

Physicians User Interface
The physicians User Interface is front-end application connected to the medical database. It includes sensor data acquisition from multiple devices, and multiples users. In order to visualize and analyse all the data sent by the various sensors, the nformation can be displayed on two types of dashboard: Operational Dashboard and Analytical Dashboard.
Operational Dashboard
Operational Dashboard displays for each patient the data gathered from multiple sensors. It is an easy-to-use and scalable software for real-time biosignals visualization. We also develop and customize operational dashboards that monitor real-time data and send out alerts in case of deviations from acceptable standards.
Analytical Dashboard
Analytical dashboards provide an analytical view of present and historic data, and act as a barometer to the essential health parameters. We assist you developing intelligent dashboards in order to predict possible future events and suggest event-based solutions. We can also develop gateways allowing you to duplicate the data in your own Cloud Server and to visualize it in your own Apps.
Gateways
We can also develop gateways allowing you to duplicate the data in your own Cloud Server and to visualize it in your own Apps.
